Educational instruction tasks now make up 12.56% of all Claude.ai usage based on Anthropic’s February 2026 sample, with the November 2025 reporting window peaking at 16%. Compare that to the roughly 4% share education and training occupies in the broader US economy and you get a category running 3-4x over-indexed. That’s a striking signal, but it’s the wrong place to stop reading.
The headline number tells you that learning is happening on AI platforms. It doesn’t tell you which training tasks AI actually handles, how learners and instructors collaborate with the model, or where the friction points sit. Those are the questions that matter when you’re sizing a budget, picking a pilot, or briefing your team on AI tutors in corporate training.
We pulled the raw Anthropic Economic Index dataset on HuggingFace and ran it through five lenses: workflow share, collaboration patterns, time spent, AI autonomy, and education-level parity.
The result is a usage map that does what the public reports don’t, which is to surface where AI is genuinely being used inside training-shaped work versus where the buzz outpaces the behavior. We also surfaced two counter-intuitive findings that should change how you frame the ROI conversation internally.
Key Takeaways
- Educational instruction is one of the most over-indexed categories on Claude.ai at 12.6%, against a ~4% share of the US economy.
- The three biggest L&D buckets (tutoring, lectures, lesson design) account for roughly 6.3% of all Claude.ai use combined.
- AI doesn’t save time on educational tasks; it changes how time is spent. Human+AI sessions run 3-7x longer than the human-only baseline. Sessions deepen, not shorten.
- The AI autonomy gradient ranges from 3.13 (Library & Reference) to 3.53 (Feedback & Coaching). Where users delegate most isn’t where you’d expect.
- Roughly 64% of educational interactions are augmentation patterns. Trainers aren’t being replaced; they’re being supported.
Why Education Is Over-Indexed in AI Adoption
Across the full Claude.ai sample, three use-case categories carve up the activity. Work tasks lead at 45.23%, personal use sits at 42.29%, and coursework comes in at 12.44%. That coursework slice maps closely to the educational instruction tasks we’ll dissect throughout this piece, and it has been one of the most stable signals in the March 2026 Economic Index report.
The trend over time shows seasonality. The January 2026 report recorded a 16% share for the November 2025 window. February 2025 sat closer to 9%. February 2026 came in at 12.6%.
The pattern fluctuates with the academic calendar, climbing during exam-heavy months and easing during breaks. For L&D buyers, the headline isn’t the exact percentage. It’s that this category consistently runs at multiples of its economic weight.
Compare that against the BLS Occupational Employment Statistics baseline of around 4% for education-related employment in the broader US economy. The gap is real, and it’s structural. Three reasons stand out.
- Training and education work is text-heavy. Lesson plans, lectures, study guides, feedback comments, assessment rubrics. All sits in the format LLMs handle best, which lowers the barrier to first use.
- Learning is naturally personalizable. One-to-many becomes one-to-one when you give a student or a trainee a private tutor that doesn’t run out of patience.
- The cost of experimentation is low. Trying a new lesson plan with AI carries less risk than testing a new medical protocol or a financial model.
For L&D leaders, the takeaway is positional. The category is moving fast, and the patterns set in 2026 will define how AI sits inside corporate training programs for the next several years. Early adopters aren’t betting on hype. They’re observing where actual usage clusters and aligning their pilots around it.
The L&D Workflow Map: Where the AI Time Goes
To make the educational data useful for an L&D buyer, we grouped the underlying O*NET tasks into seven workflow buckets that mirror how training organizations actually structure work. The chart below shows each bucket’s share of total Claude.ai usage along with the number of underlying O*NET tasks.
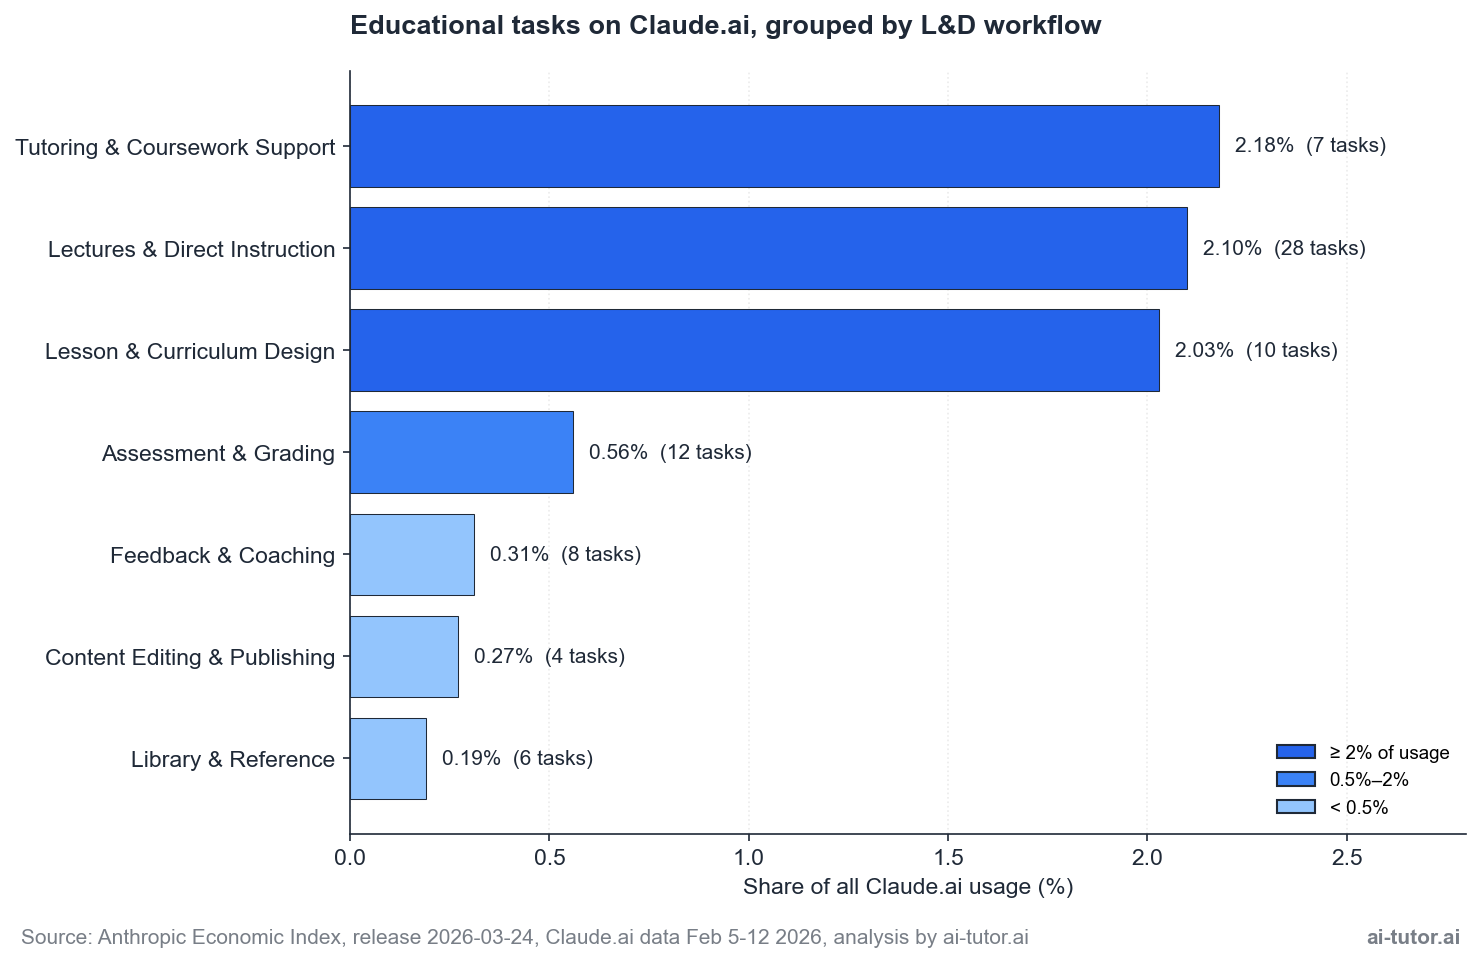
The top three buckets dominate. Tutoring, lectures, and lesson design combine to roughly 6.3% of all Claude.ai usage, which is more than half of the entire educational slice on its own. If you’re deciding where to focus a pilot, this is where the real-world behavior is concentrating.
Two negative findings matter as much as the positive ones:
- Feedback and coaching, the relational heart of L&D, is the smallest bucket at 0.31%.
- Library and reference work, which AI was widely predicted to absorb, sits at 0.19%.
The gap between what people expected AI to dominate and where actual usage has settled is meaningful, and we’ll come back to it in the strategy section.
The top 10 educational tasks
Below the bucket level, the dataset breaks down to specific O*NET tasks. The leading task is “assist students who need extra help with their coursework outside of class” at 1.97% of all Claude.ai usage.
The composition of the top 10:
- Five tasks are some form of one-to-one or small-group support
- Three tasks are about producing instructional materials
- Two tasks are direct-instruction tasks
- The tenth is grading
The pattern is clean: tutoring leads, content production follows, and direct instruction is closer behind than most L&D conversations would suggest. Notably, evaluating and grading (#10) sits ahead of advising and counseling (#9 onwards), which says something about where AI’s quality-check value is already being captured versus where it is not.
Collaboration Patterns: Not All AI Use Looks the Same
The first question most L&D buyers ask isn’t about features. It’s about jobs. Will AI replace our trainers, our instructional designers, our coaches? The Anthropic dataset tags every conversation with a collaboration pattern, which lets us answer that question with usage evidence rather than vendor narrative.
Across all of Claude.ai, the breakdown is roughly 64% augmentation and 33% automation. The exact mix:
| Collaboration Pattern | Share |
|---|---|
| Directive (automation) | 32.64% |
| Task iteration | 25.59% |
| Learning | 22.35% |
| Feedback loop | 11.52% |
| Validation | 4.86% |
| Unclassified residual | Small |
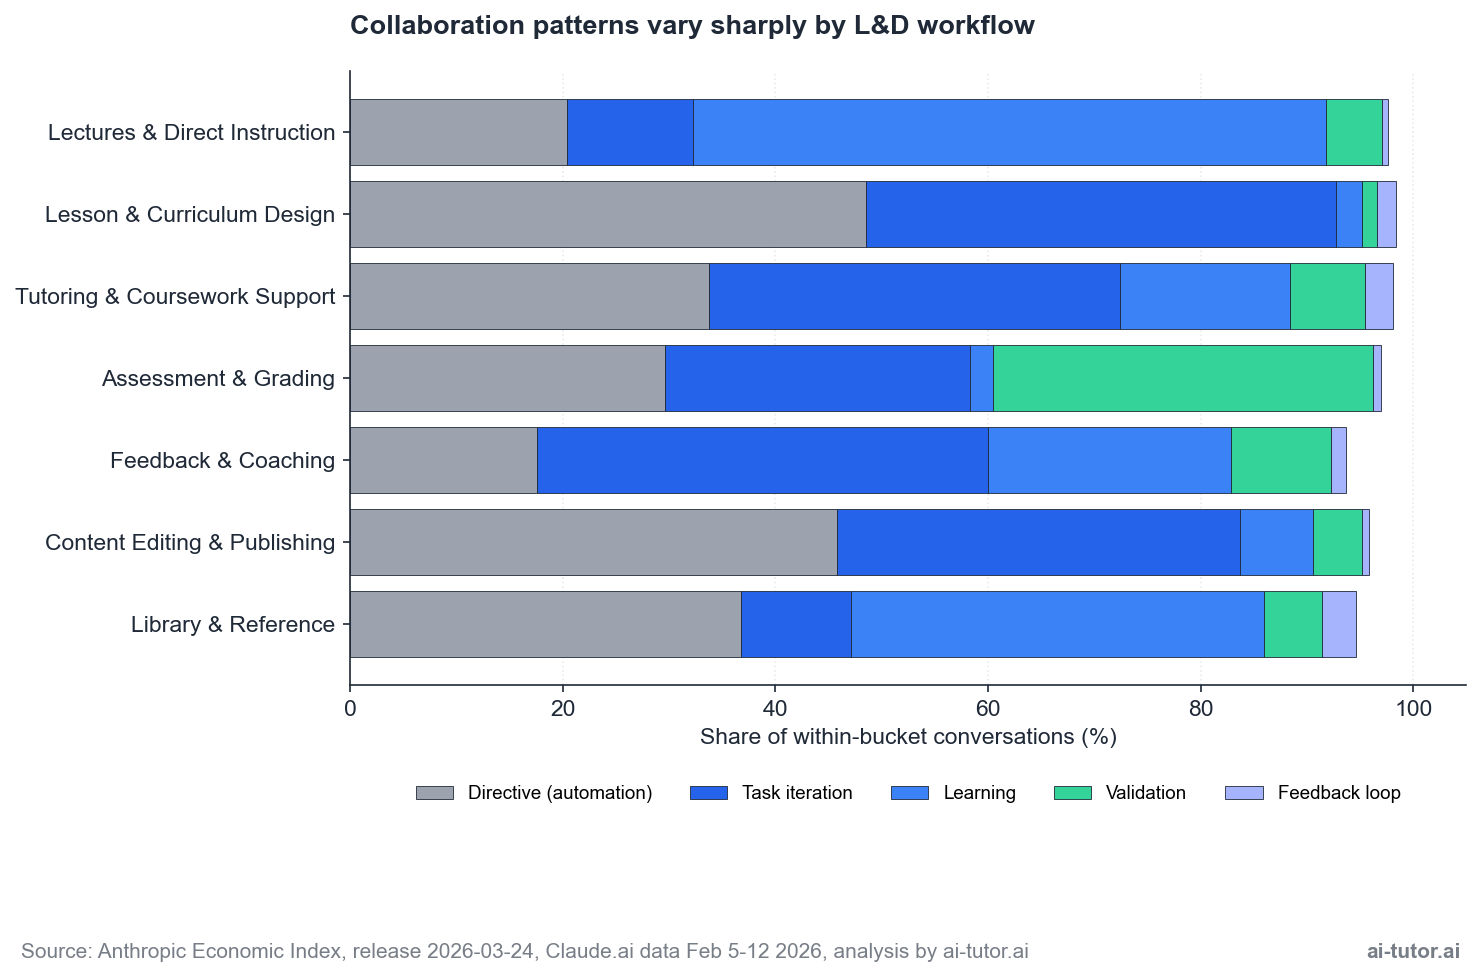
But the headline ratio hides the more interesting story, which is how sharply the pattern varies between L&D workflows. Each workflow has its own collaboration signature, and reading them tells you something different about how AI is being used in that work.
| Pattern | What It Looks Like | Where It’s Strongest |
|---|---|---|
| Directive (automation) | The user asks AI for a specific output and accepts the result with minimal back-and-forth. | Most common in content production. Lesson Design hits 49% directive, Content Editing hits 46%. |
| Task iteration | Back-and-forth refinement against a goal. | Dominant in tutoring (39%) and feedback work (42%), where the conversation shape is the point. |
| Learning | The user is learning from the AI, often before teaching the same content to others. | Hits 60% in lecture preparation. The trainer is the learner first. |
| Validation | The AI checks work the user has produced. | Strongest in Assessment & Grading at 36%, where graders use the model to spot-check evaluations or score against a rubric. We profile the leading platforms in our review of automated grading systems. |
The takeaway from the collaboration data is that directive use isn’t replacement. It’s L&D using AI as a fast first-draft engine, with humans doing the framing, the editing, and the deployment. A tool that does directive work well isn’t the same tool that does task iteration well, and the team capability needed to use each one is different.
The Depth Finding: AI Doesn’t Save Time, It Changes How You Spend It
The most counter-intuitive finding in our analysis came from the time data. The dataset records two estimates per task: how long a human alone would take to complete it, and how long the human+AI session actually ran. We expected to see time savings. We didn’t.
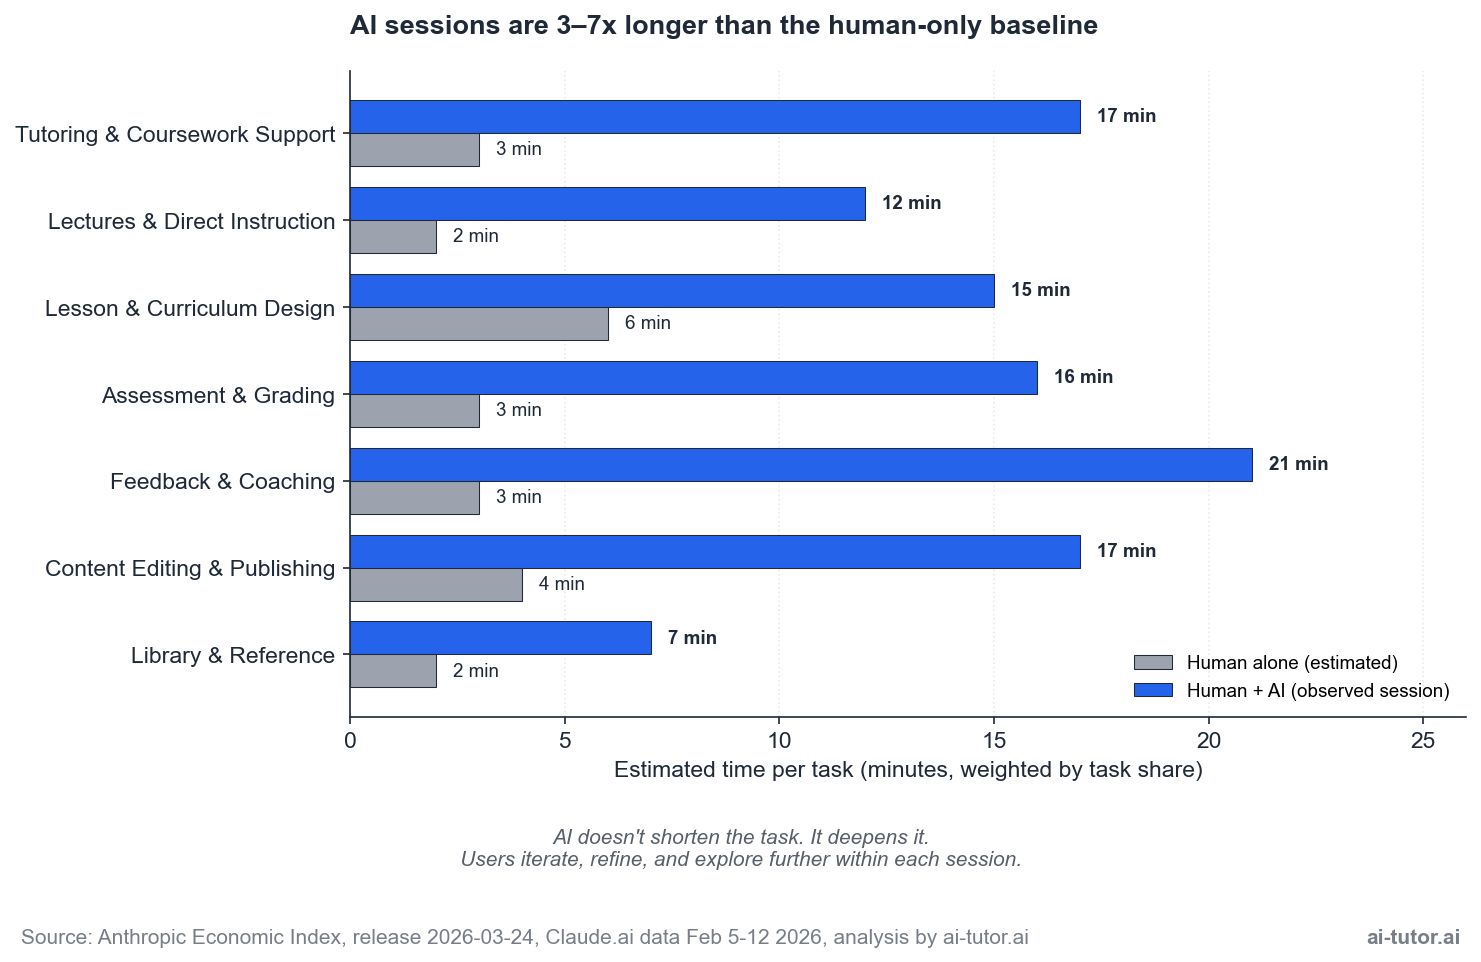
Across every L&D bucket, AI sessions ran 3-7x longer than the human-only baseline:
| Bucket | Human Alone | Human + AI |
|---|---|---|
| Tutoring | 3 minutes | 17 minutes |
| Feedback & Coaching | 3 minutes | 21 minutes |
| Lesson Design | 6 minutes | 15 minutes |
This isn’t an inefficiency story. It’s a depth story.
What’s actually happening: when a user opens a Claude session for an educational task, they don’t just get a faster version of the original task. They iterate. They ask follow-ups. They explore adjacent angles. They request alternatives. The session expands beyond the original request because the cost of asking is so low. The work being done is genuinely different from the work that would have happened without AI.
This finding should change how you frame the ROI conversation internally. The standard sales pitch for AI in L&D leans on time savings, which is the wrong frame for this category.
The right frame is depth-per-session: how much more thinking, refining, or learning happens because the friction of iteration dropped to zero. That metric is harder to measure, but it’s the one the data actually supports.
For your pilot design, this means three things:
- Don’t measure success by speed. Measure it by output quality, depth of revision, and learner outcome.
- Expect higher per-session AI usage costs than vendor benchmarks suggest.
- Train your team to use the time differently rather than to do the same work faster, because that’s not what your peers in the data are doing.
The Autonomy Gradient: Where L&D Users Delegate More to AI
The Anthropic dataset also tags each task with an AI autonomy score from 1 (user-led) to 5 (AI-led). Higher means users were more comfortable letting the model take the lead on that work. The gradient across L&D workflows is small in absolute terms but directionally informative.
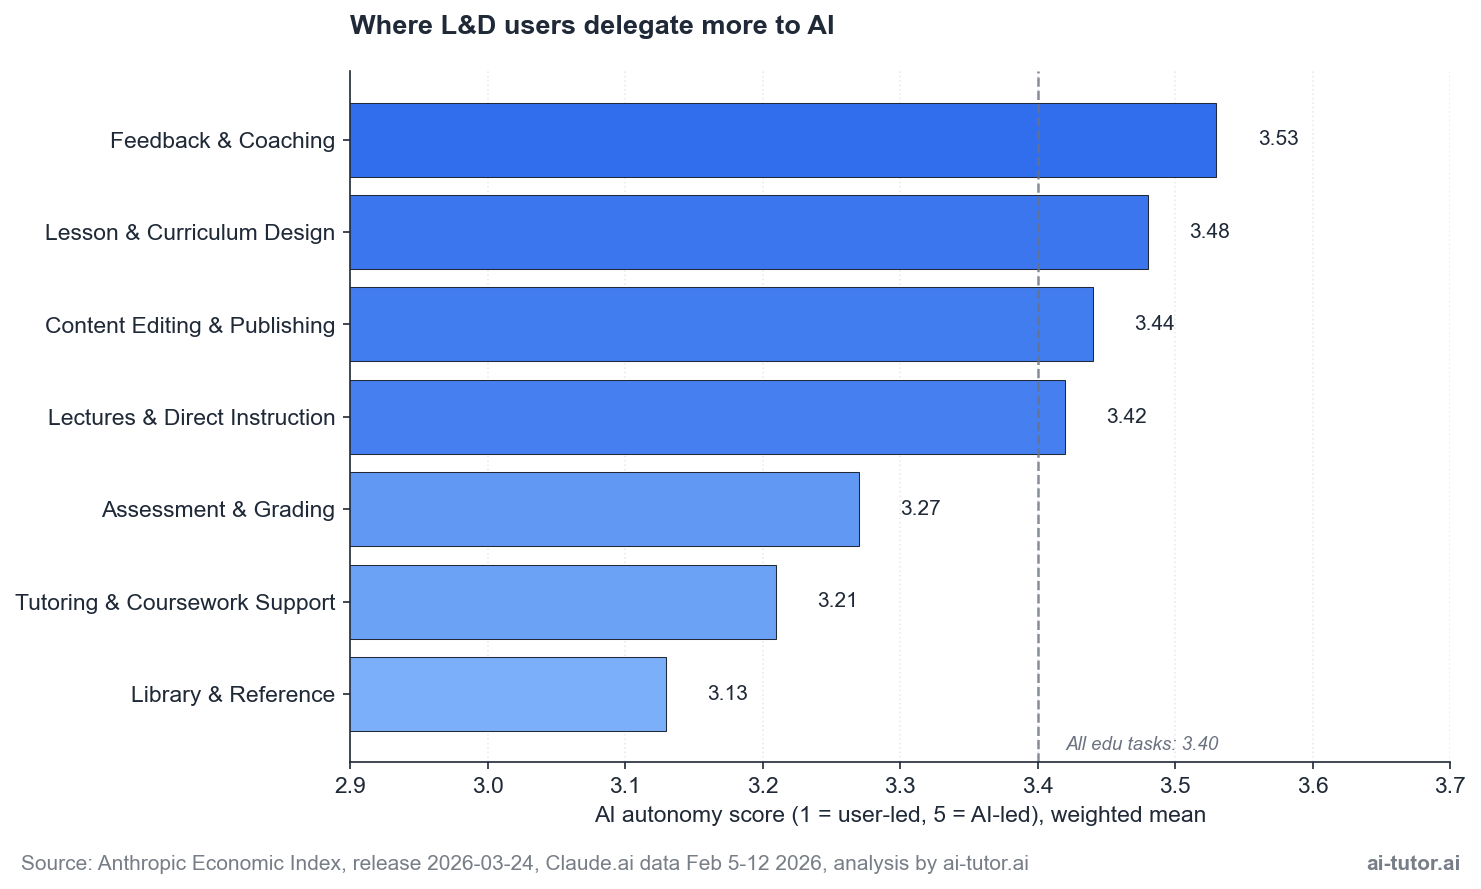
The high end of the gradient is the surprise. Feedback & Coaching scores 3.53, the highest of any bucket, despite being the smallest by volume. The interpretation: when users do bring AI into coaching work, they delegate more to it.
They ask the model to draft the framing, suggest the question, or write the response, and they accept more of what comes back. The bucket is small because the activation barrier is high, not because users distrust the model when they get there.
Lesson & Curriculum Design (3.48) and Content Editing (3.44) cluster at the high end too, which is consistent with their directive pattern. These are content-production workflows where the user has a clear output in mind and is willing to let AI generate a competent draft. Trust correlates with task clarity.
The low end is also informative:
- Tutoring & Coursework Support (3.21) sits well below the educational mean of 3.40. The biggest L&D bucket by volume is also the one where users keep the most control. Tutoring is relational work, even when the relationship is between a learner and an AI tutor, and users guard that relationship more carefully than they guard a content draft.
- Library & Reference (3.13) sits even lower, possibly reflecting verification anxiety: users want to direct the search and check the sources rather than accept AI-generated references at face value.
The autonomy gradient is a procurement signal:
- Tools that offer high-autonomy modes (full document drafting, autonomous grading) are a better fit for content production and editing workflows.
- Tools that emphasize user control and transparent retrieval are a better fit for tutoring and reference work.
Match the tool to the trust level the underlying work warrants.
A Hidden Finding: AI Operates at the User’s Education Level, Not Above It
One more numeric facet in the dataset deserves attention. The Anthropic team estimates the years of human education a task typically requires, alongside the years of education the AI’s output appears to demonstrate. Across the 258 educational tasks in our analysis, the two values track each other almost perfectly:
| Metric | Mean Years |
|---|---|
| Human education years required | 12.2 |
| AI education years demonstrated | 12.1 |
That’s a meaningful refutation of the “AI as superhuman expert” narrative. AI in educational work is operating at roughly the same education level as the user, not at PhD-equivalent strata. It performs the work the user could have done, faster or with more iteration, not work the user couldn’t have done at all.
The implication for L&D: AI is a productivity layer for your existing team, not a substitute for hiring expertise you don’t have. If your designers can’t articulate the pedagogical principle behind a module, AI won’t articulate it for them.
This also explains why some workflows show very low Claude.ai usage. Library & Reference at 0.19% likely reflects that specialized research work needs human judgment AI doesn’t yet meaningfully demonstrate. The data is consistent: where the work requires expertise above the typical user level, usage stays low. Where it doesn’t, usage scales.
What This Means for Your L&D Strategy
Pulling the data together, four practical moves emerge for L&D leaders shaping their 2026 strategy. Teams ready to operationalize these patterns can explore our corporate training platform. None of them require a moonshot. All of them are grounded in where actual usage is already concentrating.
1. Start with content production
Lesson and curriculum design is the easiest entry point. Directive use sits at 49%, autonomy is high (3.48), and the output maps to existing content workflows. Pilot here, prove the depth and quality improvement, then expand. See our overview of white-label AI training infrastructure for how teams operationalize this.
2. Measure depth, not speed
Sessions run 3-7x longer than the unaided baseline. Build success metrics around output quality, revision rounds, and learner outcomes per session. The time-savings frame will sink your pilot.
3. Augment tutoring, don’t replace it
Tutoring leads the educational slice at 2.18%, with task iteration at 39%, but the autonomy score is the lowest of the major buckets at 3.21. Position AI as a learner-controlled collaboration partner, not as an autonomous tutor. Our roundup of AI tutors built for student-led learning shows what this looks like in practice.
4. Equip your trainers as learners
Lecture preparation runs 60% learning collaboration. Train your trainers first. Their proficiency with AI as a study partner is a leading indicator of how well your wider rollout will land.
The order matters:
- Content production gives you a measurable win and builds team confidence.
- Depth-aware metrics protect the pilot from a false-negative ROI verdict.
- Tutoring is where the learner-facing impact compounds.
- Trainer enablement is the multiplier that makes the rest stick.
The lowest-volume bucket in the entire educational slice is feedback and coaching at 0.31%, but it has the highest autonomy score (3.53) when users do show up. That gap is interesting. Either there’s a tooling barrier preventing usage, or there’s a cultural one. Worth investigating in your own organization, because closing it could be a meaningful capability advantage.
One framing point for the budget conversation. The 64% augmentation share isn’t an argument for smaller AI investment. It’s an argument for a different shape of investment. Augmentation tooling needs strong workflow integration, training, and change management. Automation tooling can be deployed and measured more directly. The mix of patterns in your L&D function should drive how you split your spend across software, services, and enablement.
The Caveats: What the Data Doesn’t Tell You
The Anthropic Economic Index is the most transparent dataset on real AI usage we have right now, and we lean on it heavily. It also has limits. Reading the data well means reading the limits well too.
- Claude.ai only. The dataset reflects one platform. ChatGPT, Gemini, Copilot, and a long tail of vertical tools have their own usage shapes. The patterns are likely directionally similar, but the exact numbers won’t generalize.
- Window-to-window variance. The 12.6% to 16% range we cite reflects different reporting windows and follows the academic calendar. Any single-window number is a snapshot, not a constant.
- O*NET mapping is imperfect. The Economic Index uses the O*NET task taxonomy, which was built for occupational research, not L&D segmentation. Some corporate training tasks sit in adjacent occupational categories (HR, communications, technical writing) and won’t show up under the educational umbrella.
- Coursework includes students. The 12.44% coursework use case captures both students and the people who teach or design for them. We can’t cleanly separate consumer learning from corporate L&D usage.
- Time and autonomy are estimates. The “human-only time” and “AI autonomy” metrics are derived by Claude itself analysing each conversation. They’re directional, not measured. We treat them as signals, not specifications.
- Behavior, not best practice. The data shows what people are doing, not what they should be doing. Treat it as a usage map, not a recipe book.
None of this invalidates the analysis. It just sets the right ceiling on how the data should drive decisions. We treat the Economic Index as a strong directional input, not a deterministic guide. Your own pilot data, once you have it, is the corrective.
Frequently Asked Questions
Is the 16% figure for educational AI use accurate?
It was accurate for the November 2025 reporting window cited in the January 2026 Economic Index report. The February 2026 sample we analyzed shows 12.56%. Both numbers are real, and the range fluctuates with the academic calendar. Treat the headline as a category that consistently runs at multiples of its economic share.
Will AI replace our corporate trainers?
The data says no. Roughly 64% of all Claude.ai use is augmentation, and inside the educational slice the dominant collaboration patterns are task iteration, learning, and validation. AI also operates at the user’s education level, not above it. Trainers stay central; AI changes how they work, not whether they exist.
If AI sessions are longer than human-only work, where’s the ROI?
In depth, not speed. Users iterate more, explore more angles, and produce more refined outputs in the same workflow slot. The right ROI metrics for L&D are output quality, revision rounds, and learner outcomes per session. The time-savings frame is the wrong one for educational work.
Where should we start with AI in L&D?
Lesson and curriculum design. It’s the lowest-friction bucket, the directive collaboration pattern is well understood, autonomy scores are high (3.48), and the output is measurable against your existing content production cycle. Once that pilot proves out, expand into tutoring and trainer enablement.
How is this analysis different from generic AI tool reviews?
It’s grounded in real usage data from a public dataset, not vendor pitches or speculation about what AI might one day do. We pulled the raw HuggingFace dataset, ran it through five analytical lenses, and surfaced the counter-intuitive findings (depth not speed, autonomy gradient, education-year parity) that the headline reports skip over. The behavior is the source.
Can we trust Claude.ai data as a guide for our employees?
With caveats. It’s directional, not deterministic. The shape of usage on Claude.ai is informative for sequencing your pilots and setting expectations, but your employees’ usage will depend on your tool choices, your enablement, and your governance. Pilot before rollout, and let your own data correct the public benchmarks.