Educational instruction now accounts for 12.8% of all Claude.ai usage that Anthropic can match to an occupation, the third-largest group on the platform after computing and media work. The same occupations hold 5.9% of US jobs. That puts learning-related work at more than twice its weight in the economy, and it’s still the wrong place to stop reading.
The headline tells you learning happens on AI platforms. It doesn’t tell you which training tasks AI actually handles, what L&D teams produce with it, how much time it saves, or where people keep control. Those are the questions that matter when you’re sizing a budget, picking a pilot, or briefing your team on AI tutors in corporate training.
We pulled the raw Anthropic Economic Index dataset on Hugging Face (the June 2026 release, covering May 2026 Claude.ai conversations), matched 170 educational tasks to seven L&D workflows, and profiled three corporate training roles. Then we read each one through six lenses: workflow share, what gets produced, collaboration pattern, time, AI autonomy, and education level. We re-ran everything on the April 2026 data too. The patterns held.
One finding runs through all six lenses. L&D uses AI in two distinct modes. When the job is producing material, people hand the work to the model and get it back many times faster. When the job is teaching or learning, people stay in the conversation, keep control, and save far less time. That split should shape how you pilot, measure, and buy.
Key Takeaways
- Educational instruction is 12.8% of occupation-matched Claude.ai usage against 5.9% of US jobs. Conversations matching the work of training managers and instructional coordinators run at about 7x their share of employment.
- Lesson and curriculum design (2.35% of all usage) and tutoring (2.34%) are the two biggest L&D workflows, and they sit at opposite ends of almost every other measure.
- Slide decks are the single biggest output for training-management work. 51% of those conversations end in a presentation, about 22 times the platform-wide rate.
- AI turns hours into minutes. Lesson design runs an estimated 18x faster with AI (8.8 hours down to 30 minutes), while tutoring, lectures and coaching run about 4x faster and still take close to an hour.
- Across educational tasks, 57% of conversations are augmentation (iterating, learning, validating) and 43% are automation. Production work leans to automation, and tutoring is 57% learning conversations.
Why Education Is Over-Indexed in AI Adoption
Anthropic maps each sampled conversation to the occupation whose work it most resembles. In May 2026, Educational Instruction and Library work took 12.8% of that occupation-matched usage, behind Computer and Mathematical (23.8%) and Arts, Design and Media (13.6%). April came in at 11.9%, and the June 2026 Economic Index report shows how strongly usage follows calendars, so expect the share to move with exam seasons and term breaks.
A second signal points the same way. Anthropic also tags every conversation by purpose, and 16.5% of all Claude.ai conversations are coursework.
Compare that against the BLS Occupational Employment and Wage Statistics for May 2025, where educational instruction and library occupations hold 9.1 million of 155.5 million US jobs (5.9%). The corporate L&D roles show an even sharper pattern.
- Training and Development Managers hold 0.03% of US jobs and 0.21% of Claude.ai usage, roughly 7x.
- Instructional Coordinators (the people who design curricula and course material) hold 0.15% of jobs and 1.01% of usage, also about 7x.
- Training and Development Specialists, the hands-on corporate trainers, are the exception. They hold 0.29% of jobs and only 0.13% of usage.
That last line surprised us. The people who design and manage training show up far more than the people who deliver it, which fits everything else in this analysis. Three reasons explain why learning work runs so far above its economic weight.
- Training work is text-heavy. Lesson plans, slide decks, study guides, feedback and rubrics all sit in the format LLMs handle best, which lowers the barrier to first use.
- Learning is naturally personalizable. One-to-many becomes one-to-one when a trainee has a private tutor that never runs out of patience.
- The cost of experimentation is low. Trying a new lesson plan with AI carries less risk than testing a new medical protocol or a financial model.
For L&D leaders, the takeaway is positional. The habits forming now will define how AI sits inside corporate training for years. The useful question is which training work that usage actually covers.
The L&D Workflow Map: Where the AI Time Goes
To make the data useful for an L&D buyer, we took the 170 educational O*NET tasks that show up in the May 2026 data (together 12.3% of all Claude.ai usage) and grouped them into seven workflow buckets that mirror how training teams structure their work.
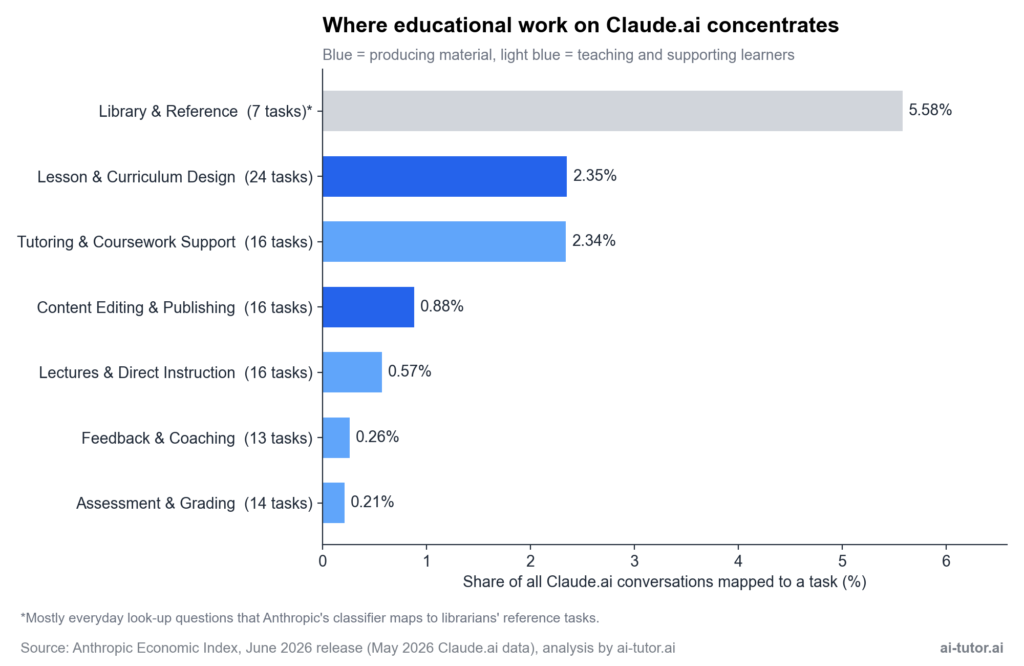
Library and Reference looks like the giant here, and it deserves a warning label. Its top task is “search standard reference materials to answer patrons’ questions”, which is where everyday look-up questions appear to land. Only 12% of that bucket is coursework and 26% is work. We keep it on the map for completeness and leave it out of the L&D reading.
What remains splits almost evenly between two kinds of work.
- Producing material. Lesson and curriculum design (2.35%) plus content editing and publishing (0.88%).
- Teaching and supporting learners. Tutoring (2.34%), lectures (0.57%), feedback and coaching (0.26%), and assessment (0.21%).
Feedback and coaching, the relational heart of L&D, is still one of the smallest buckets. Assessment is the smallest of all, which matters if a vendor pitch leans on automated grading.
The top educational tasks
Set the look-up tasks aside and the leading educational task is “answer students’ questions” at 1.15% of all Claude.ai usage. The next two are both material production, “develop teaching or training materials, such as handouts, study materials, or quizzes” (0.98%) and “develop instructional materials, such as lesson plans, handouts, or examinations” (0.61%). After those come writing articles and books, syllabus and course-note development, small-group tutoring, and exam preparation.
The pattern is clean. Answering learners’ questions leads, material production follows closely, and grading barely registers. Knowing which tasks people bring to AI is half the picture, though. The other half is what comes back out.
What L&D Teams Actually Produce With AI
The June 2026 release added something the earlier data lacked. Every conversation now carries a label for its main output, from slide decks and reports to explanations and code. That lets us see what training work actually produces with Claude.
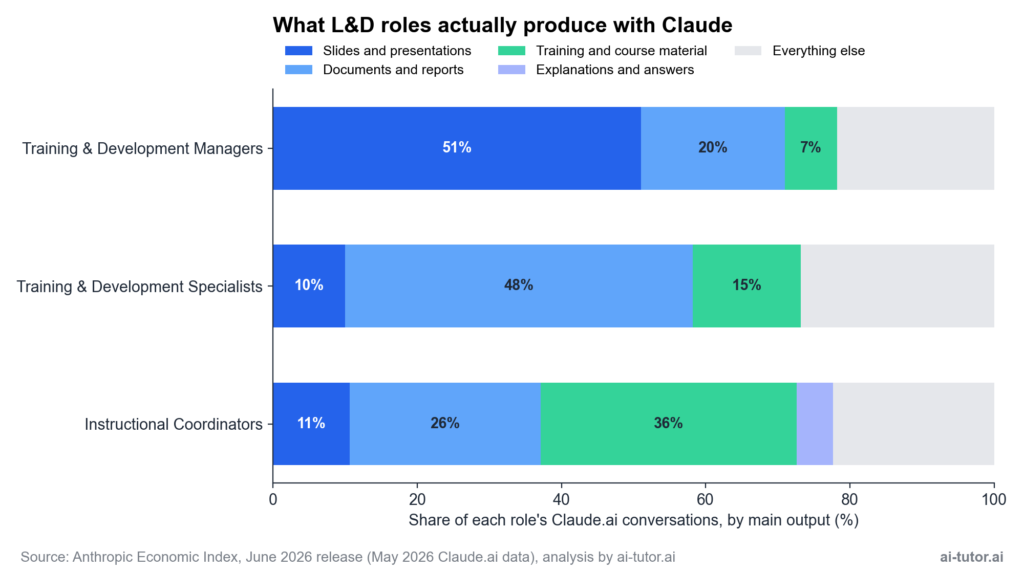
Each role has a clear signature.
- Training and Development Managers produce slide decks in 51% of conversations, and documents in another 20%. Across all of Claude.ai, presentations are only 2.3% of outputs.
- Training and Development Specialists produce documents and reports in 48% of conversations, then training material (15%) and slides (10%).
- Instructional Coordinators lead with course and training material (36%), then documents (26%) and slides (11%).
The workflow buckets tell the same story from the task side. Lesson and curriculum design produces training material in 40% of conversations, documents in 29%, and slides in 12%. Tutoring looks completely different, with explanations in 37% and study material in 32%. The role patterns are solid, and April shows almost identical shares. Treat the exact percentages as directional, since the role label describes the work in a conversation and says nothing about who typed it.
That caveat matters for the managers’ figure. Only about half of those conversations are work (49%), and 43% are coursework, so students building presentations are part of that 51%. The specialists’ profile is the cleanest corporate signal in the set, with 76% of conversations tagged as work. Either way, the output tells you what kind of help people want. How they get it is the next question.
Collaboration Patterns Show Two Kinds of AI Use
The first question most L&D buyers ask is about jobs. Will AI replace our trainers, our instructional designers, our coaches? Anthropic tags every conversation with one of five collaboration patterns, which lets us answer with usage evidence. It groups two of them (directive and feedback loop) as automation, where the model does the work, and three (task iteration, learning and validation) as augmentation, where the person stays in the loop.
Across all of Claude.ai, the split is close to even, with 49% automation and 51% augmentation. Educational tasks lean further toward augmentation.
| Collaboration pattern | All Claude.ai | Educational tasks |
|---|---|---|
| Directive (automation) | 31% | 37% |
| Feedback loop (automation) | 16% | 6% |
| Task iteration (augmentation) | 30% | 27% |
| Learning (augmentation) | 17% | 26% |
| Validation (augmentation) | 3% | 3% |
| Automation total | 49% | 43% |
The headline ratio hides the more interesting story. Each L&D workflow has its own collaboration signature.
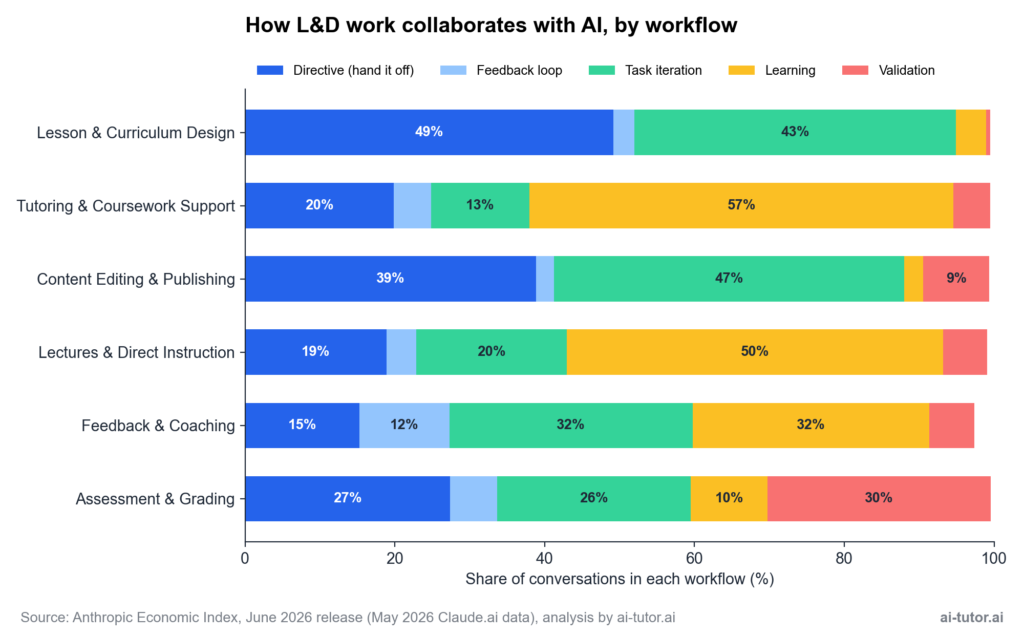
| Pattern | What it looks like | Where it’s strongest |
|---|---|---|
| Directive | The user asks for a specific output and accepts the result with little back-and-forth. | Lesson and curriculum design (49%). Training-management work goes further, at 54%. |
| Task iteration | Back-and-forth refinement against a goal. | Content editing (47%) and lesson design (43%), where drafts get shaped over several turns. |
| Learning | The user is learning from the AI. | Tutoring (57%) and lectures (50%). Most of this is learners themselves, since 82% of tutoring conversations are coursework. |
| Validation | The AI checks work the user has already produced. | Assessment and grading (30%), where people use the model to spot-check marking against a rubric. We profile the leading platforms in our review of automated grading systems. |
The two modes are now visible. Production work (lesson design, training-management decks) is where L&D hands work to AI, with automation at 52% for lesson design and 57% for training-management work. Teaching work is where people stay in the conversation, with automation at 25% for tutoring and 23% for lectures. A tool built for fast first drafts and a tool built for guided learning conversations are different products, and your team needs different skills for each. The time data makes the gap between them concrete.
AI Turns Hours of L&D Work Into Minutes, Unevenly
For every conversation, Anthropic estimates two times: how long a competent person would need to do the task alone (in hours) and how long the task took with AI (in minutes). Across all of Claude.ai, that is 4.7 hours alone against 40 minutes with AI, about 7x faster.
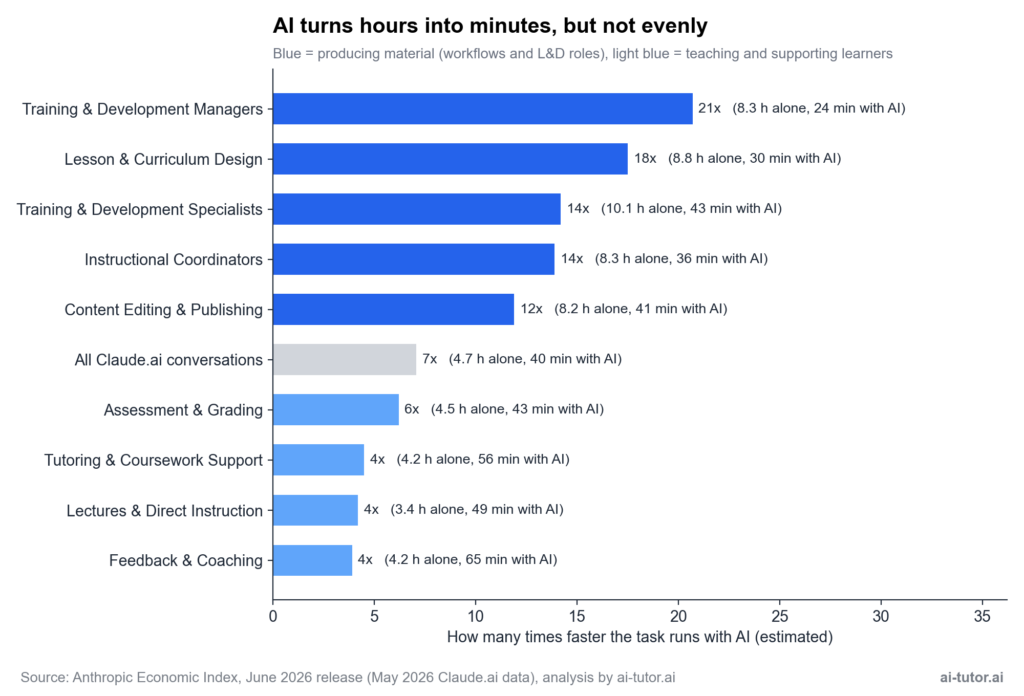
| Workflow or role | Alone | With AI | Faster by |
|---|---|---|---|
| Training & Development Managers | 8.3 hours | 24 minutes | 21x |
| Lesson & Curriculum Design | 8.8 hours | 30 minutes | 18x |
| Training & Development Specialists | 10.1 hours | 43 minutes | 14x |
| Content Editing & Publishing | 8.2 hours | 41 minutes | 12x |
| Assessment & Grading | 4.5 hours | 43 minutes | 6x |
| Tutoring & Coursework Support | 4.2 hours | 56 minutes | 4x |
| Feedback & Coaching | 4.2 hours | 65 minutes | 4x |
Producing material is where AI saves the most time. A day of lesson design becomes half an hour, and training-management work (mostly decks) compresses even further. Those are the largest multipliers in the L&D data and well above the platform average.
Teaching work behaves differently. Tutoring, lectures and coaching still save time, about 4x, yet they produce the longest AI sessions in the set, close to an hour each. These are learning conversations, full of follow-ups, alternative explanations and practice. People spend the time on purpose.
The direction of this finding is solid, since every workflow and role shows a speed-up in both April and May. The multipliers are estimates made by Claude reading each conversation, so read 18x as an order of magnitude.
This should change how you frame ROI internally. Each mode needs its own yardstick.
- Measure production by time and throughput. The data supports it. Track hours per module, per deck, per assessment bank.
- Measure teaching by learning outcomes. Tutoring sessions run close to an hour. Measure them by assessment results and completion, since speed is the weaker signal there.
- Budget for the freed hours. If a day of design work becomes 30 minutes, decide in advance whether the hours go to more content, better content, or more time with learners.
Where L&D Users Delegate More to AI
Anthropic also scores each conversation for how much the AI leads, from 1 (fully user-led) to 5 (fully AI-led). The Claude.ai average is 2.74. The L&D gradient follows the two modes almost exactly.
| Workflow or role | AI autonomy (1-5) |
|---|---|
| Training & Development Managers | 3.35 |
| Lesson & Curriculum Design | 3.13 |
| Training & Development Specialists | 3.08 |
| Instructional Coordinators | 3.04 |
| Content Editing & Publishing | 2.86 |
| All Claude.ai | 2.74 |
| Assessment & Grading | 2.69 |
| Feedback & Coaching | 2.63 |
| Tutoring & Coursework Support | 2.49 |
| Lectures & Direct Instruction | 2.49 |
Everything above the platform average is production work. Everything below it is teaching, assessing or coaching. Trust follows task clarity. When the output is a defined artifact (a deck, a handout, a quiz), people let the model lead. When the output is someone’s understanding, they keep the steering wheel.
Tutoring sits at the bottom, which matters for anyone deploying an AI tutor. The learners in this data use AI as a tutor by asking, checking and asking again (57% learning conversations), and they lead those sessions themselves.
The gradient doubles as a procurement signal.
- Tools with high-autonomy modes (full document drafting, deck generation, question-bank creation) fit content production.
- Tools that keep the learner in control, explain their reasoning and show their sources fit tutoring and coaching.
Match the tool to the trust level the underlying work warrants. There is one more dimension worth checking before you do.
AI Works Close to the User’s Education Level
For each conversation, Anthropic estimates the years of education the task requires from a person and the years of education the AI’s contribution reflects. Across the 170 educational tasks, the two sit less than a year apart.
| Scope | Human education years required | AI education years shown |
|---|---|---|
| All educational tasks | 11.9 | 12.7 |
| Lesson & Curriculum Design | 13.4 | 13.9 |
| Training & Development Managers | 13.1 | 14.2 |
| All Claude.ai | 11.8 | 12.6 |
That undercuts the “AI as superhuman expert” narrative. In educational work, the model operates about one school year above the request, in line with the June report’s finding that Claude’s responses read about a year of schooling above the prompts. It performs work the user could broadly have done, much faster.
The implication for L&D is that AI multiplies the expertise your team already has. If your designers can’t articulate the learning objective behind a module, the model won’t supply it for them. It will just produce the module faster.
What This Means for Your L&D Strategy
Pulling the data together, four practical moves emerge for L&D leaders. Teams ready to operationalize them can explore our corporate training platform. None of them requires a moonshot, and all of them follow where usage already concentrates.
1. Start with content production
Lesson design, training decks and course material are the easiest entry point. They carry the biggest time multipliers (12-21x), the highest autonomy scores, and outputs you can count. Pilot here, prove the hours saved, then expand.
2. Measure each mode on its own terms
Report production pilots in hours and throughput. Report tutoring and coaching pilots in learner outcomes. Mixing the two yardsticks makes the teaching side look weak on speed and the production side look thin on learning impact.
3. Keep tutoring learner-led
Tutoring is one of the two biggest L&D workflows (2.34% of all usage), with the lowest autonomy score (2.49) and a majority of learning conversations. Position AI as a patient study partner the learner steers. Our roundup of AI tutors built for student-led learning shows what this looks like in practice.
4. Equip your trainers as learners
Half of lecture-related conversations are learning conversations. Trainers who use AI to get up to speed on a topic before they teach it are the ones who will coach others well. Train them first, and hands-on specialists especially, since they are the L&D role least represented in the usage data.
The order matters.
- Content production gives you a measurable win and builds team confidence.
- Separate yardsticks protect each pilot from being judged on the wrong metric.
- Tutoring is where the learner-facing impact compounds.
- Trainer enablement is the multiplier that makes the rest stick.
Feedback and coaching remains the open question. It is one of the smallest workflows (0.26%), the conversations run longest (65 minutes), and people split their time evenly between refining and learning. Whether the barrier is tooling or culture is worth investigating in your own organization, because coaching at scale is where many L&D teams feel most stretched.
One framing point for the budget conversation. The near-even split between automation and augmentation calls for two budget lines. Production tooling can be deployed and measured directly. Learner-facing tooling needs workflow integration, enablement and change management. The balance of the two modes in your L&D function should drive how you split spend across software, services and training.
What the Data Doesn’t Tell You
The Anthropic Economic Index is the most transparent public dataset on real AI usage, and we lean on it heavily. It also has limits, and reading the data well means reading those limits too.
- Claude.ai only. The dataset reflects one platform (chat and Cowork on Free, Pro and Max plans). ChatGPT, Gemini, Copilot and vertical L&D tools have their own usage shapes. The patterns are likely directionally similar, and the exact numbers won’t generalize.
- Occupation labels describe the work. A conversation is matched to the occupation whose tasks it resembles. A student building a presentation can land under training-management work. That’s why we report the work and coursework shares next to each role.
- O*NET mapping is imperfect. The Economic Index uses the O*NET task taxonomy, built for occupational research. Some corporate training work sits in HR, communications or technical writing tasks and won’t show up under the educational umbrella. Everyday look-ups land on librarians’ reference tasks, which is why we set that bucket aside.
- Time, autonomy and education are estimates. Claude produces these by reading each conversation. They’re consistent enough to compare workflows and too rough to budget on directly.
- Snapshot windows. Our figures cover May 2026, with April as a check. Usage shifts with academic calendars, so any single month is a snapshot.
- Behavior, not best practice. The data shows what people do. Treat it as a usage map for sequencing decisions and let your own pilot data correct it.
How we built it. We used the global Claude.ai file from the June 2026 release (May 2026 data, April as a stability check). We linked each task to its occupation through its O*NET 30.2 task ID and kept the tasks of educational occupations (SOC group 25). We then assigned them to the seven workflows with keyword rules on the task text, leaving 0.08% of usage unassigned. Workflow figures are averages weighted by each task’s usage share. Role figures come from Anthropic’s occupation-level rows for SOC 11-3131, 13-1151 and 25-9031. Employment shares are from BLS OEWS, May 2025.
Frequently Asked Questions
How much of AI usage is educational?
In Anthropic’s June 2026 release, educational instruction accounts for 12.8% of occupation-matched Claude.ai usage (May 2026) and 11.9% in April, the third-largest group on the platform. Separately, 16.5% of all conversations are coursework. Both run at more than twice education’s 5.9% share of US jobs, and the exact figure moves with the academic calendar.
Will AI replace our corporate trainers?
The data points to a split. Production work is increasingly handed off, with training-management work at 57% automation and lesson design at 52%. Teaching work stays collaborative, with tutoring at 25% automation and lectures at 23%. AI also works about one school year above the request, close to the user’s own level. Trainers who design and deliver will spend less time producing material and more time on the parts learners value most. We look at the classroom side of this question in AI vs human teachers.
Does AI actually save time in L&D?
Yes, and by a lot where L&D produces material. Anthropic’s estimates put lesson and curriculum design at 8.8 hours alone against 30 minutes with AI (about 18x), and training-management work at about 21x. Tutoring and coaching save less, about 4x, and still run close to an hour per session. Measure production pilots in hours and teaching pilots in learner outcomes.
Where should we start with AI in L&D?
Content production. Lesson design, training decks and course material show the largest time savings, the highest AI autonomy, and outputs you can count against your current production cycle. Once that pilot proves out, expand into learner-led tutoring and trainer enablement.
How is this analysis different from generic AI tool reviews?
It starts from real usage data in a public dataset. We pulled the raw Hugging Face files, mapped 170 educational tasks to L&D workflows, profiled three training roles, and checked every pattern against a second month. The findings the headline reports skip (the two modes, the output signatures, the uneven time savings) come from that work.
Can we trust Claude.ai data as a guide for our employees?
As a direction, yes. The shape of usage on Claude.ai is useful for sequencing pilots and setting expectations, but your employees’ usage will depend on your tools, enablement and governance. Pilot before rollout, and let your own data correct the public benchmarks.